- April 23, 2018
- Posted by: BlueSkies
- Categories: Extreme Weather, Forensic Meteorology, Uncategorized

Using Forensic Meteorology to Verify Hurricane-Related Insurance Claims
2017 was a record-setting year for global insured (and un-insured) losses due to natural disasters, driven in no small part by the costliest hurricane season in U.S. history. Most of the estimated $200 billion in U.S. damages resulted from the wraths of hurricanes Harvey, Irma, and Marie during August and September 2017; and while nature required only a few weeks to wreak such havoc, assessing, tallying, and ultimately rebuilding from the damage will take far longer.
Although assessing hurricane-related claims may seem fairly straightforward to those unfamiliar with the process – “Hey, the building was either hit by a hurricane or it wasn’t, am-I-right?” – meteorologists and experienced claims adjusters know that often isn’t the case, especially as one moves farther from the eye of the storm and therefore farther from the most extreme and obvious impacts.
It is with these more ambiguous claims that forensic meteorology offers valuable insight – reconstructing conditions at the loss location to identify and quantify hurricane-related hazards.
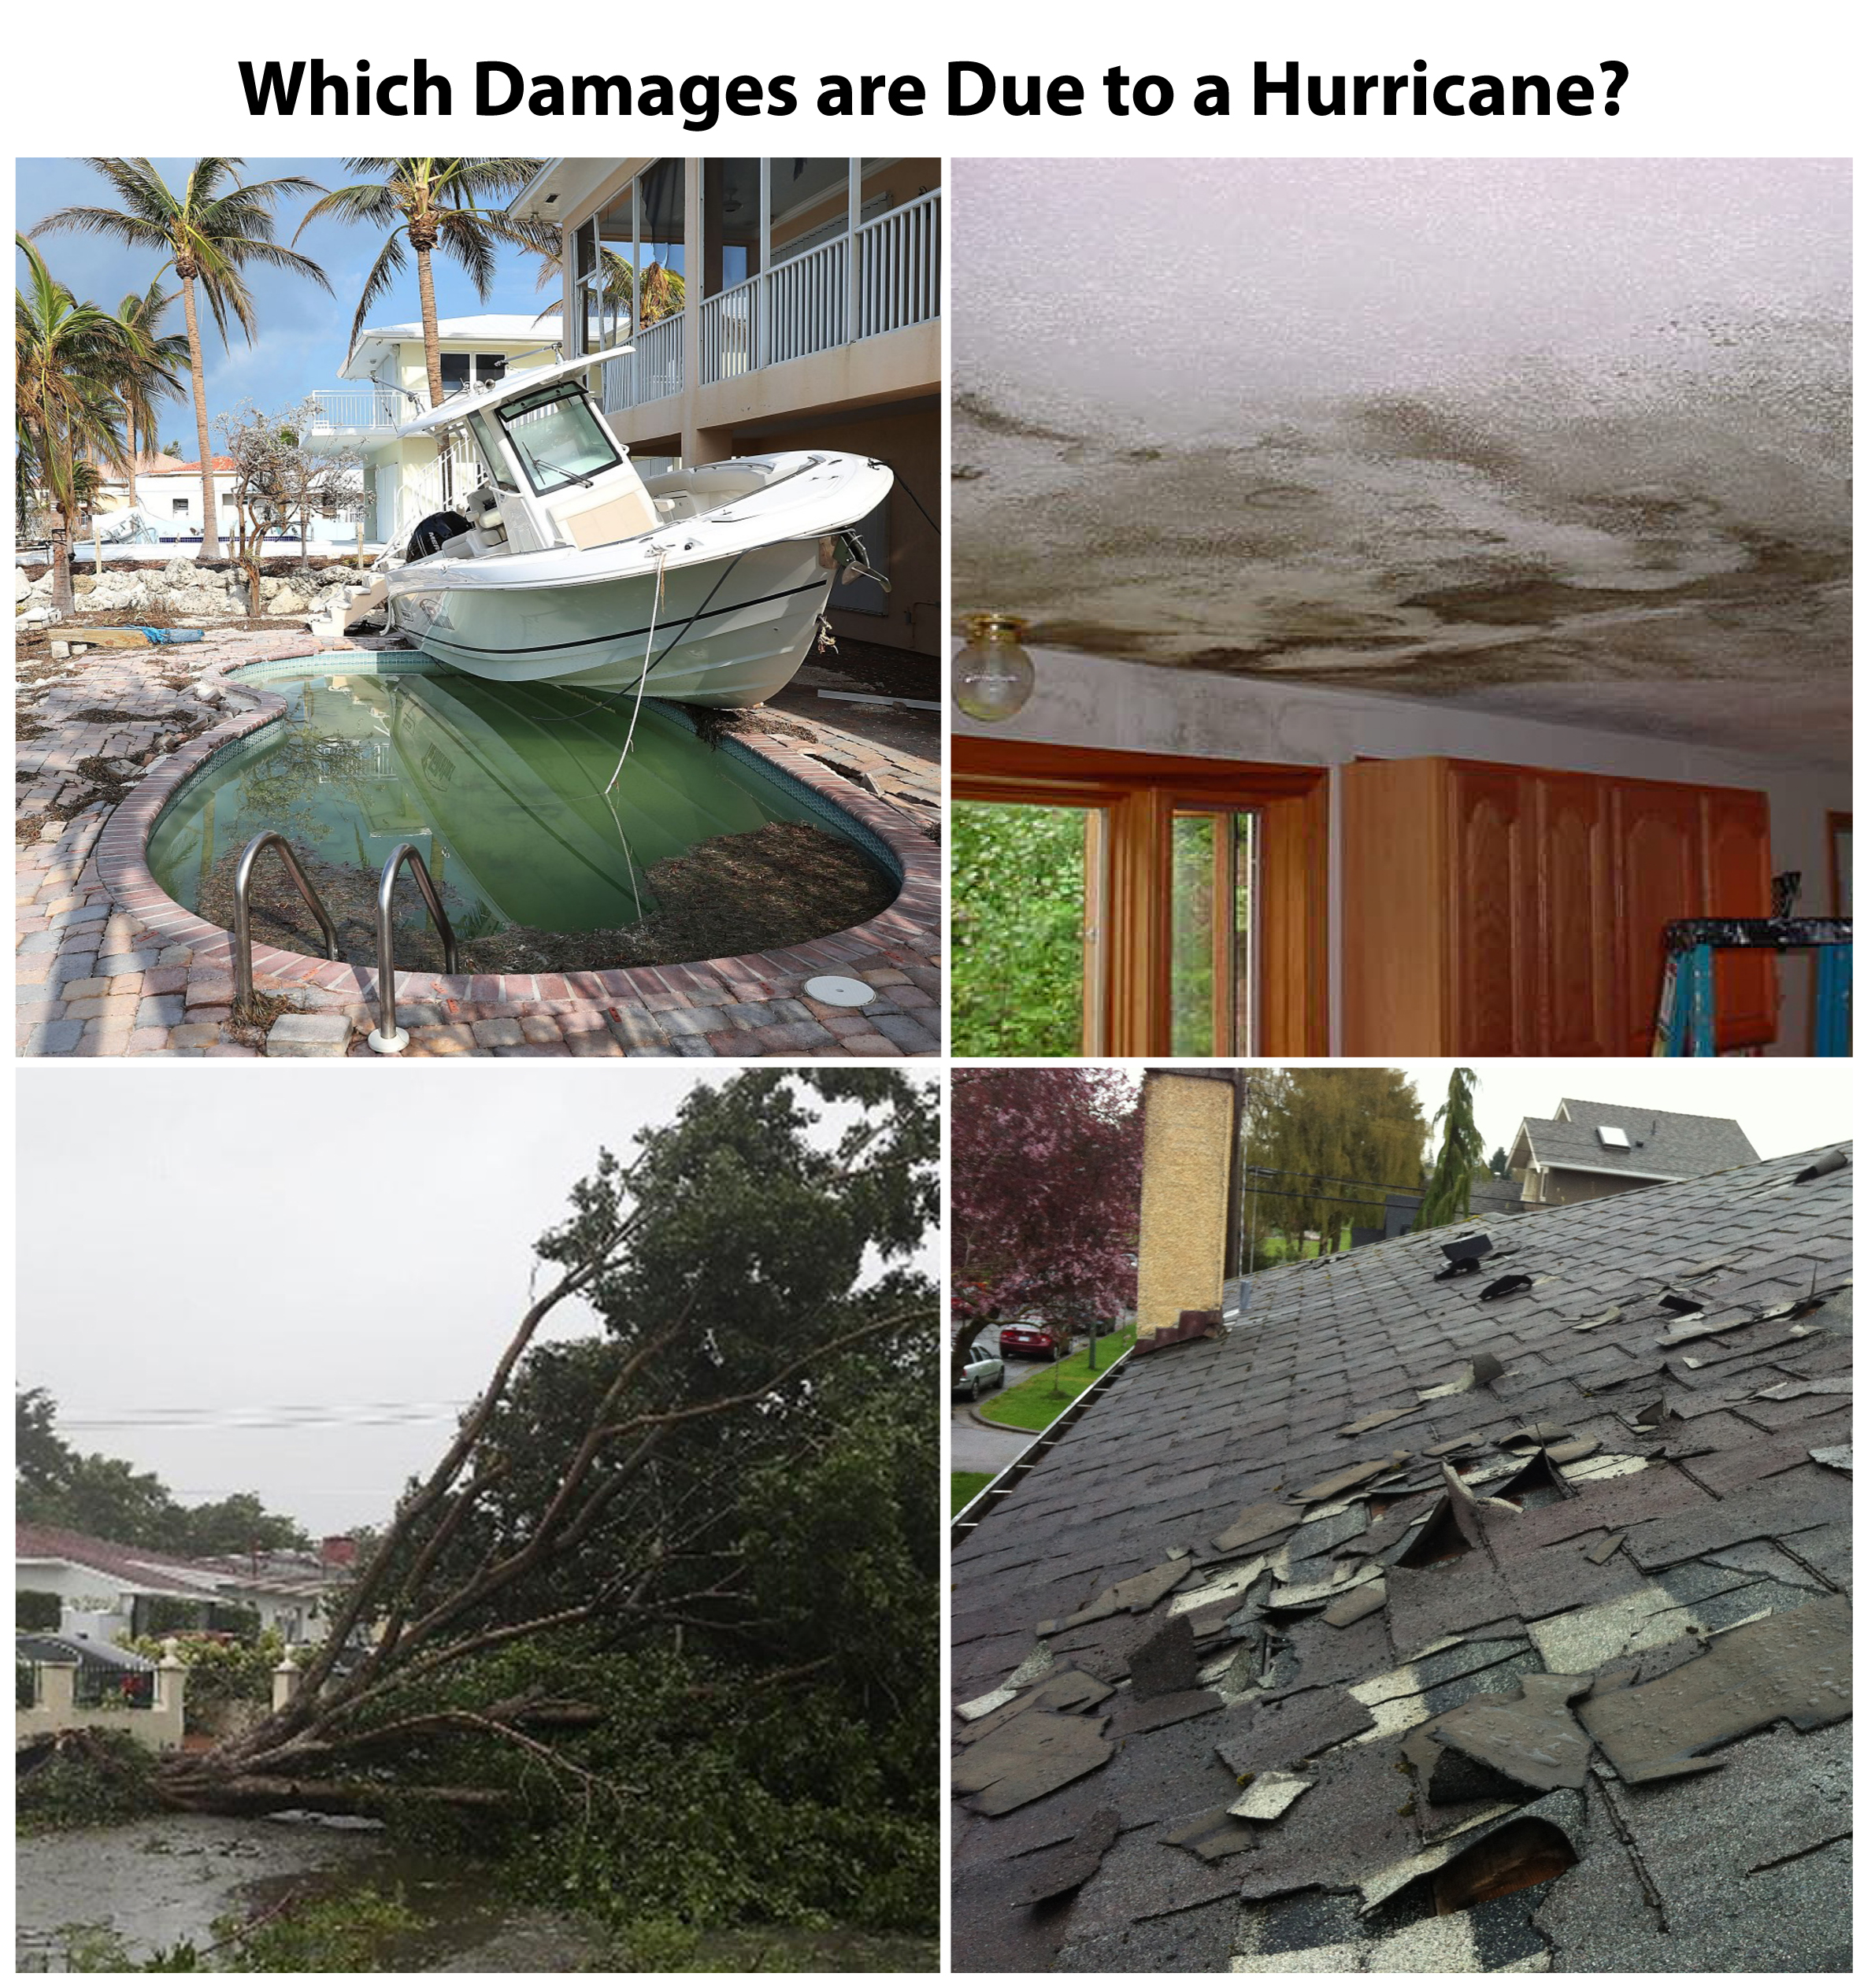
Almost without exception, damage due to tropical cyclones (hurricanes and tropical storms) can be attributed to high winds, extreme rainfall, and/or storm surge. The magnitude of these impacts at any given location depends on numerous factors beyond simply the closest approach of the eye of the storm. The strength, size, and speed of the tropical cyclone; coastal topography; orientation of the coast relative to the storm’s wind field; distance from the coast; and the relative location of landfall all play determining roles.
Failure to understand and account for these factors can lead to under- or over-estimation of impacts, and ultimately to poor coverage decisions.
What follows is a discussion of each major impact (wind, rain, and storm surge) and the data and analytical tools available to reconstruct conditions at a given location. The following discussion specifically addresses tropical cyclone-related hazards, but many of the same analytical methods can be applied to other types of weather events, including severe thunderstorms.
High Winds
In the 45 years since the Saffir-Simpson scale was introduced, hurricane wind speeds have become nearly synonymous with hurricane intensity and damage potential. A Category 1 storm with sustained surface winds of 74-95 mph is described as producing “some damage,” mainly to roofs, fences, trees, and telephone poles; while a Category 5 storm with sustained winds above 157 mph is described as producing “catastrophic damage,” completely destroying a large percentage of framed structures and leaving the impacted area uninhabitable for weeks to months.
While there is value to the Saffir-Simpson scale – increasing winds do indeed produce increasing damage – the maximum sustained surface wind speed near the eye of a hurricane does not capture the whole story of that storm’s destructive potential.
Two storms with similar maximum wind speeds can produce vastly different amounts of damage – the size of the storm, and therefore the size of its wind field, as well as the forward speed of the storm greatly influence its destructive potential, as Category 3 hurricanes Ivan ($18.8 billion in damages) and Dennis ($2.5 billion in damages) demonstrated when they impacted the same areas along the Gulf Coast just 10 months apart in 2004 and 2005. Despite similar maximum wind speeds, Ivan – a larger storm – produced seven and a half times more damage. In other words, size matters with hurricanes.
Recognizing that maximum wind speed isn’t the best measure of a hurricane’s destructive potential, the tropical meteorology community has been developing new, more comprehensive indices. Such indices include the Cyclone Damage Potential (CDP) index as well as Integrated Kinetic Energy, both of which account for a tropical cyclone’s size as well as its maximum sustained winds.
Although these metrics have not yet seen widespread use outside the meteorology community, expansion to the emergency management community and ultimately to the media and the general public is likely in coming years as these groups seek a more accurate understanding of – and more effective way to communicate – hurricane-related dangers.

Straight-Line Winds
Winds within a hurricane – both sustained winds and gusts – are generally strongest in and near the eye wall, with wind speeds decreasing with distance from the center of the storm. The smaller the hurricane, the more quickly winds decrease with distance.
For example, Hurricane Andrew was a very compact storm whose sustained hurricane-force winds extended outward only 30-45 miles, while Hurricane Irma – a much larger storm – had hurricane-force winds extending outward nearly 100 miles. Despite similar maximum wind speeds near the eye of the storm, if a property were 50 miles from the center of Hurricane Irma, it would have experienced significantly higher wind speeds than a property 50 miles from the center of Hurricane Andrew.
Tornadoes

Tornadoes can and most often do occur far removed from the center of a hurricane, in the outer bands of discrete thunderstorms that rake counterclockwise away from the eye of the storm. The vast majority of these tornadoes develop in the right-front quadrant of the hurricane, relative to its direction of motion. During Hurricane Irma, 23 tornadoes were identified across the state of Florida. All occurred in areas impacted by Irma’s right-front quadrant.
Tornadoes that form in association with hurricanes are generally short-lived and relatively weak, occurring most often near the coast where wind shear is strongest as the discrete thunderstorms move ashore. However, tornadoes in tropical cyclones can occur further inland: more than two dozen tornadoes were reported in and around the Houston metro area during Hurricane Harvey, some nearly 80 miles from the coast.
If significant wind damage is observed at a property located 50-200 miles from the center of a tropical cyclone, tornadic impact should be investigated as a possible explanation.
Data
Straight-line wind speeds are assessed through both in-situ (weather station) observations as well as post-storm damage surveys. For locations near a weather radar site, radar velocity data of near-surface winds can also be extrapolated to estimate surface winds (this method is less useful for locations far from the radar, where extrapolation becomes less accurate).
Hurricane wind gusts can and often do cause even the most robust weather station anemometers to stop working. During Hurricane Irma, many of the weather stations located at Miami-area airports stopped reporting wind speeds during the peak of the storm.
Therefore, to obtain the most comprehensive and rigorous reconstruction of wind conditions, all three data sources should be used. Weather station data provide on-the-ground observations, while damage surveys assess the aftermath to determine the wind speeds necessary to produce the observed damage. In areas removed from weather stations or population centers, weather radar offers data on winds aloft and insight into winds near the surface.
Tornadoes, which are small-scale phenomena that rarely happen to impact a weather station, are assessed through damage surveys and radar data. The storm cells that produce tornadoes in tropical cyclones are generally shallow, so radar data is most useful for locations within 60-70 miles of the radar site. Beyond that distance, the radar beam may overshoot the top of the storm.
Extreme Rainfall
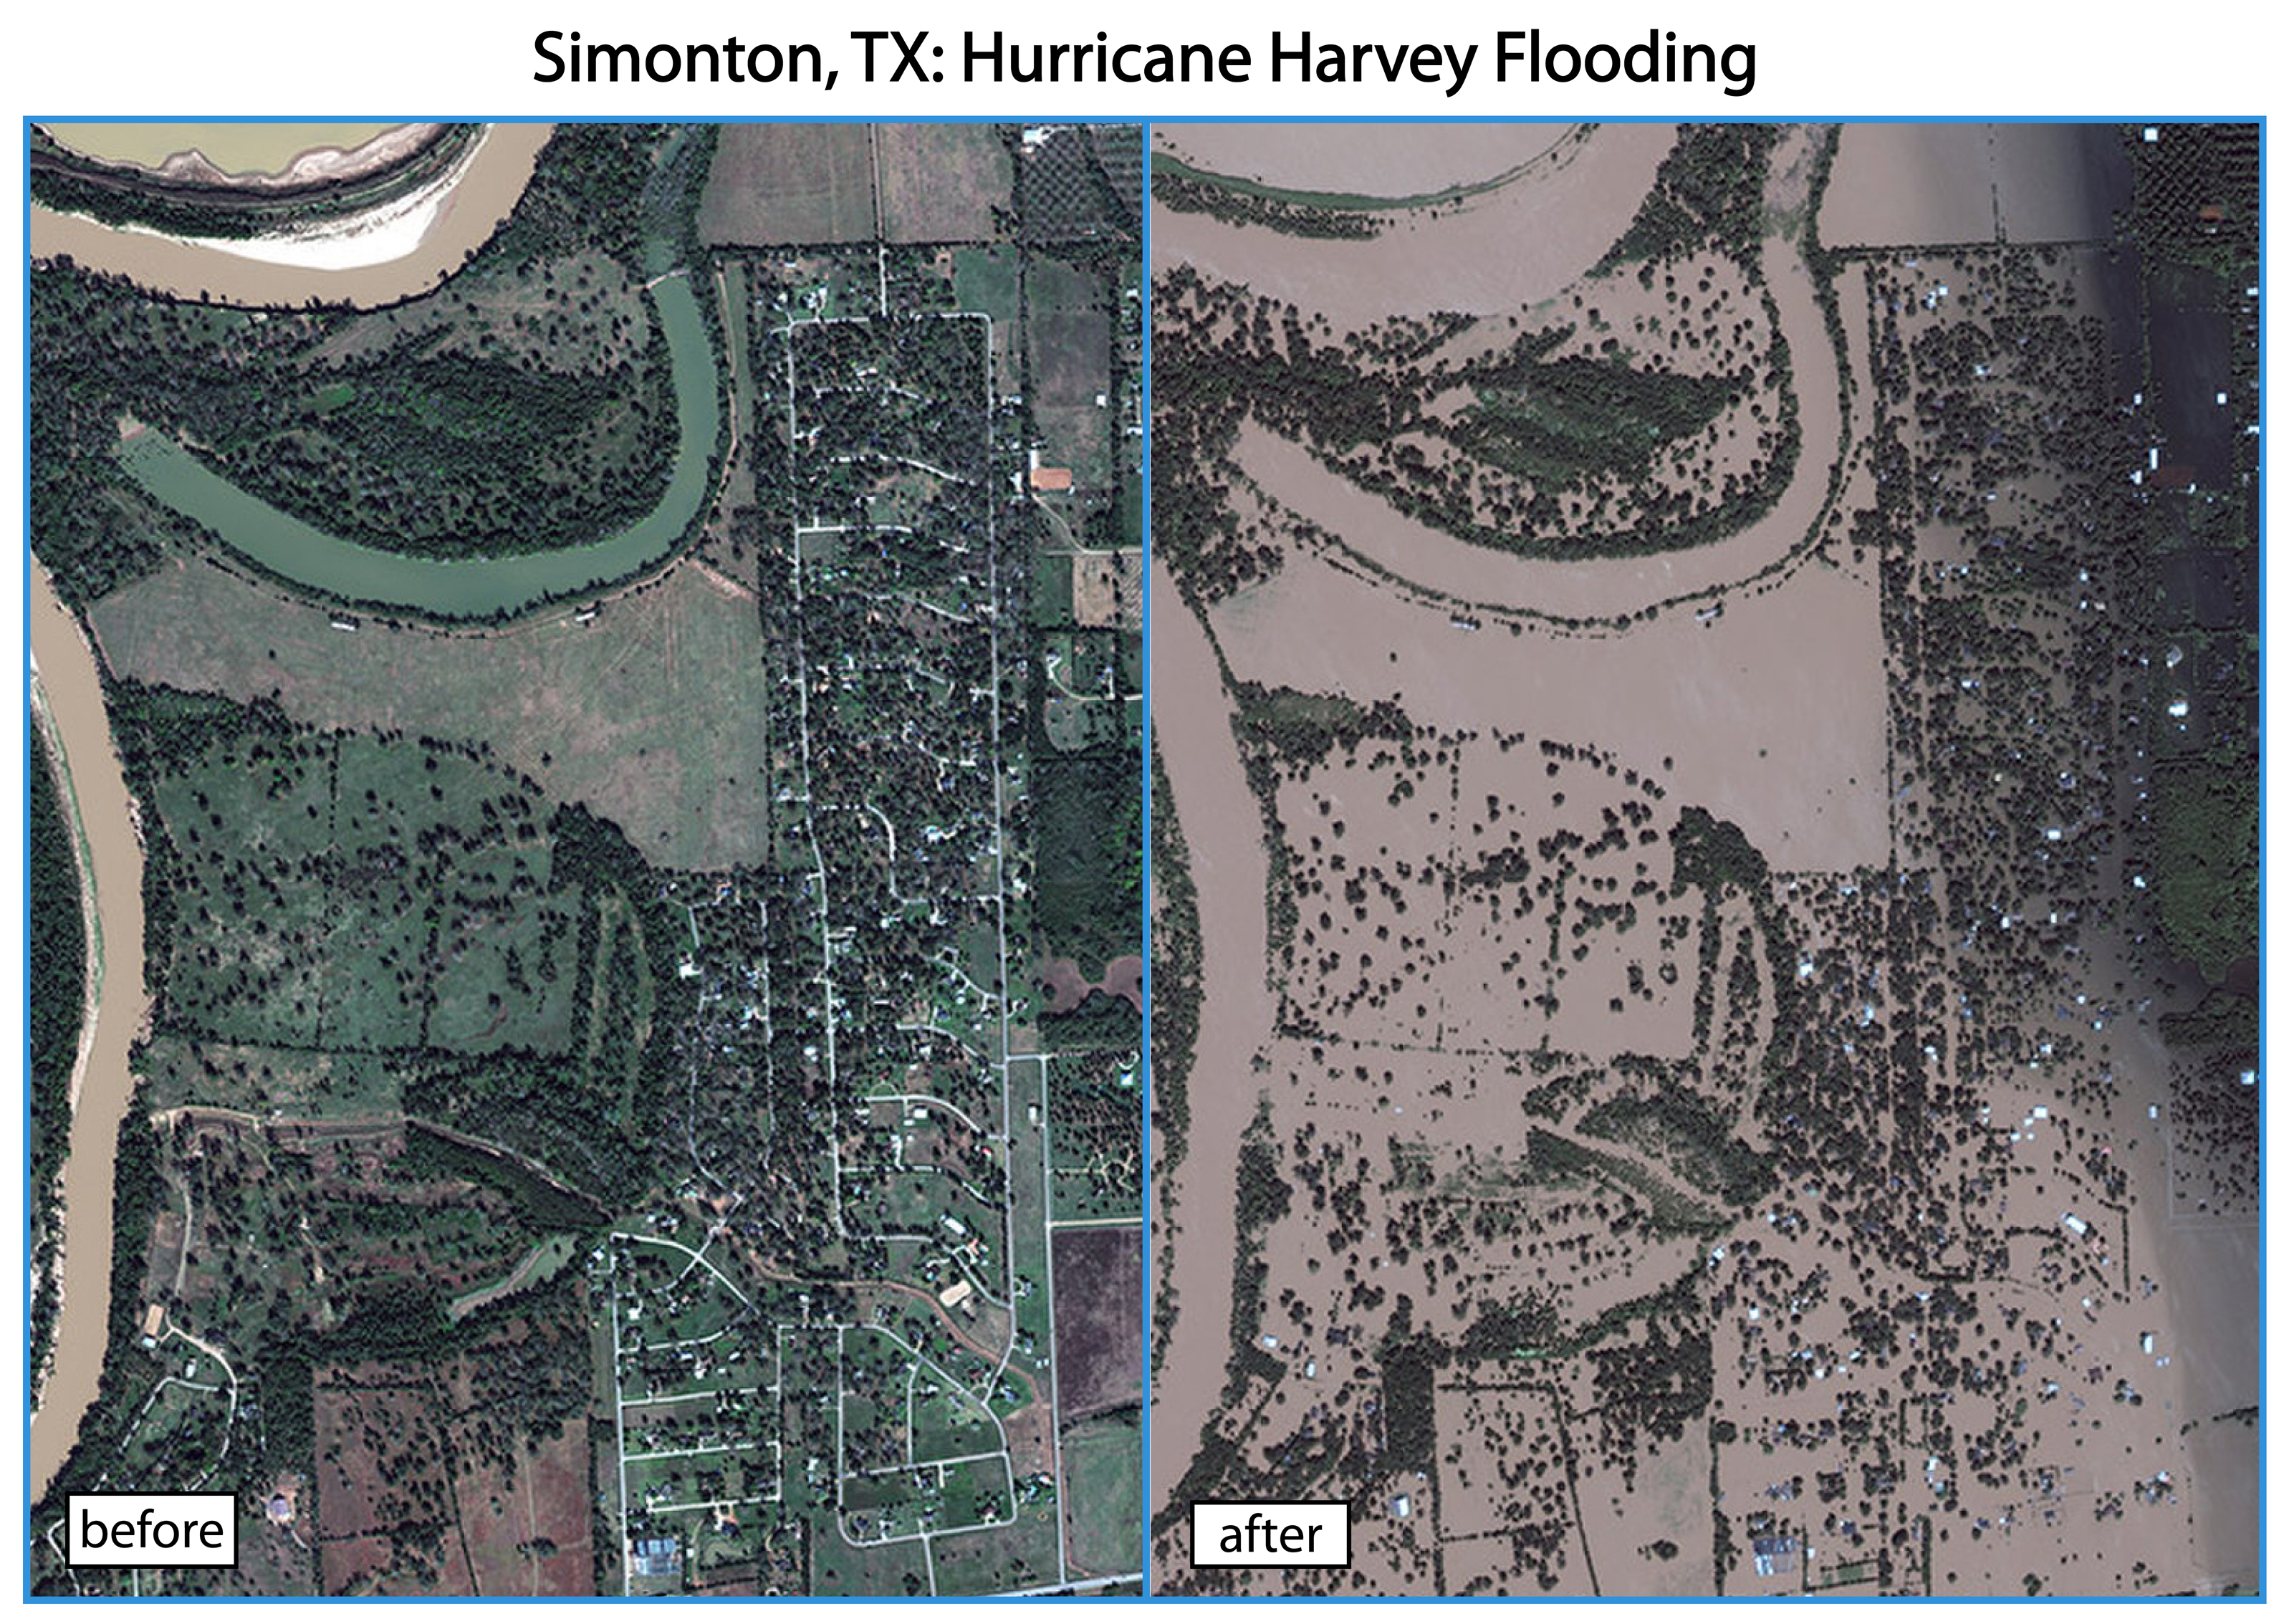
As Hurricane Harvey demonstrated to devastating effect in August of last year, rainfall-induced flooding can be at least as destructive as extreme winds during tropical cyclones. Harvey is estimated to have caused more than $100 billion in damages, primarily due to widespread flooding in and around the Houston metropolitan area – far more damage than was wrought by the storm’s winds.
Although the more-than-four-feet of rain that Harvey squeezed out of the skies over Texas were truly unprecedented, most tropical cyclones produce intense, heavy rainfall that can lead to flooding both during and after the storm, often far inland of the landfall location. Over the last 30 years, such inland flooding has been responsible for more than a quarter of the deaths associated with tropical cyclones in the United States.
Data
In-situ rain gauge data provide measured rainfall totals at specific locations. In urban areas rain gauges may be less than 5 miles apart, while in rural areas, they can be 50 or more miles apart. Radar data can fill in the gaps between rain gauges by providing rainfall estimates anywhere within the radar’s coverage area.
Radars estimate rainfall using an algorithm that associates radar reflectivity values with rainfall rates. The exact relationship between reflectivity and rainfall rate can differ between storm events; so to determine whether the radar rainfall estimates are accurate for a given event, in-situ measurements should be compared to the radar estimate of rainfall at those locations. Confidence in the radar estimate increases when the radar-estimated rainfall total is similar to what was measured at a rain gauge at the same location.
Rain gauges and weather radar can tell us how much it rained but not whether that rainfall actually caused flooding. To determine the locations and extent of flooding, we turn to storm reports and damage surveys. The National Weather Service collects storm reports for all tropical cyclones, and the US Geological Survey conducts damage surveys for most major flooding events. For prolonged, widespread flooding events like Hurricane Harvey, satellite data can also reveal which areas were impacted.
Storm Surge
Along the coast, storm surge is often the greatest threat to life and property when a hurricane strikes. As with hurricane winds, the most severe storm surge typically accompanies the right-front quadrant of the storm, where the storm’s wind field and forward motion act to push water onshore. But unlike hurricane winds, which tend to be similar in nearby areas and gradually decrease with distance from the eye, storm surge can vary greatly even within the span of a few miles.
The reason for this variability is that storm surge is a complex phenomenon dependent on characteristics of both the hurricane and the local landscape.
Among the local variables that impact storm surge are the width and slope of the continental shelf as well as the geometry of the coast, bays and estuaries. All else being equal, storm surge along a coast fronted by a wide, shallow continental shelf – as exists along much of the Gulf Coast – will be significantly greater than along a coast where the continental shelf drops away quickly.
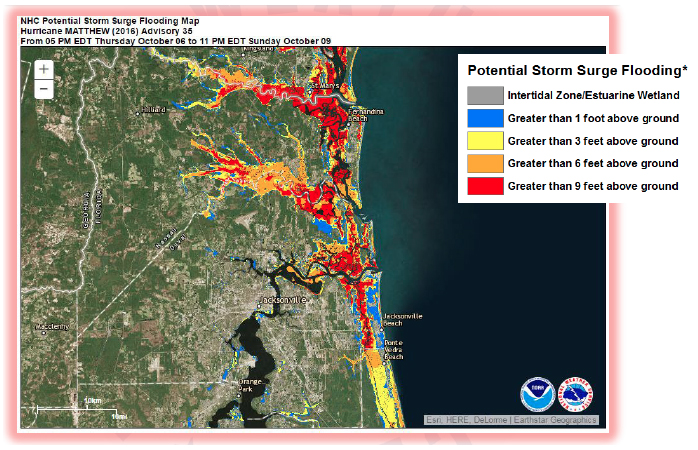
Among the storm-specific variables that impact storm surge are hurricane intensity, size, forward speed, and angle of approach to the coastline. The slightest change to any one of these characteristics can significantly increase or decrease storm surge potential. Despite popular belief, it is the winds of the hurricane that generate the vast majority of its storm surge – less than 5% of the surge is due to the low-pressure effect of the storm “sucking up” the ocean toward its center.
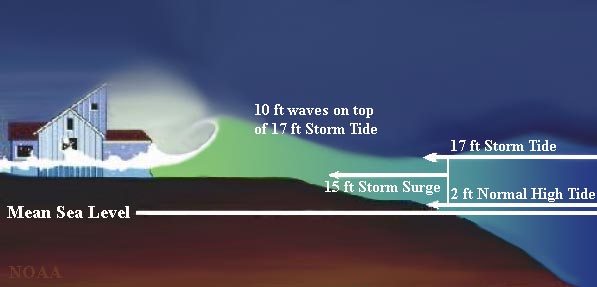
In addition to storm surge – formally defined as the abnormal rise of water generated by a storm – one must also consider the local astronomical tide. Storm surge rides atop the normal tidal flow, creating a combined “storm tide” that ultimately determines the depth and extent of inundation. A storm that strikes at high tide can result in inundation several feet deeper than if that same storm strikes at low tide.
A final factor that influences damage along the immediate coast is wave action. Neither the storm surge nor the storm tide take into account the effects of large, wind-drive waves that batter the coast during a hurricane. Wave action can significantly increase the impact of storm tide along the immediate coast, overtopping seawalls and sandbags where the storm tide alone would not. Often, the height of waves riding atop the storm tide can exceed the height of the storm tide itself.
As a recent example, during Hurricane Irma, wave wash marks in the lower Florida Keys were observed 10 – 15 feet above the storm tide. Water has a weight of 1,700 pounds per cubic yard, so prolonged pounding by large waves can cause substantial structural damage.
Data
Ahead of a hurricane, the United States Geological Survey (USGS) typically deploys a network of temporary storm-tide sensors along the immediate coast in the projected path of the storm. These sensors record the depth of the storm tide throughout the event, and comparison of the maximum storm tide at nearby sensors provides insight into the range of water levels experienced along a particular stretch of coastline.
In those areas not covered by the storm tide sensor network, the USGS often performs surveys of visible high-water marks in the immediate aftermath of the storm. High-water marks are created when small, light debris carried along the top of the water is deposited on vertical surfaces like walls and doorways, and as with storm tide sensors, they provide data about the maximum water height at a given location.
The National Weather Service also performs post-storm damage surveys that include findings regarding storm surge, maximum inundation, and wave height, if available.
The Bottom Line
Tropical cyclones tend to be well-documented extreme weather events. Data from weather stations and radar sites generally become available within a few days of the event, while post-tropical cyclone reports and summary storm reports require weeks to months of processing before they are released. Forensic meteorological analysis of site-specific storm impacts can therefore begin almost immediately and can be updated as new data becomes available.
If you are involved in a weather-related investigation and would like to discuss how a forensic meteorologist could support that work, please reach out to Blue Skies Meteorological Services for a free, no-obligation consultation.