- October 27, 2016
- Posted by: BlueSkies
- Categories: Communication and Education, Extreme Weather, Forecasting, Uncategorized
“Run from the water. Hide from the wind.” This adage speaks to a truth long known among meteorologists and emergency management officials: it’s generally not the wind that’ll kill you – it’s the water.
Between 1963 and 2012, only 11% of tropical cyclone (hurricane and tropical storm) deaths were due directly to the wind. Yes, hurricane-force winds can be frighteningly destructive and frankly awe-inspiring, but when the numbers are tallied, water is undeniably the deadlier threat. Combined, storm surge, inland flooding due to heavy rains, and high surf are responsible for 88% of tropical cyclone deaths. The storm surge alone kills nearly half of all people who lose their lives during these events.
The reasons for this are simple but not necessarily obvious.

Why Water Not Wind
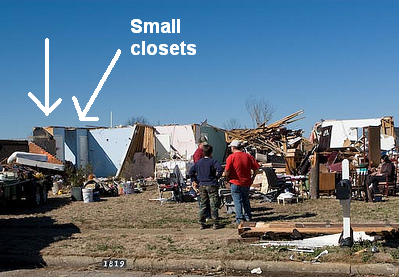
Especially in areas with modern building codes and construction, structures can withstand long duration strong winds. Even when structures are significantly damaged by debris or the wind itself, they continue to offer some shelter and protection from the wind. This is why people in the path of a tornado are advised not to jump in their car and drive away but rather to shelter in place in an interior room on the lowest floor. The roof can be ripped off a building and the exterior walls toppled, yet a tiny bathroom or closet often remains intact and offers a pocket of safety amidst the chaos.
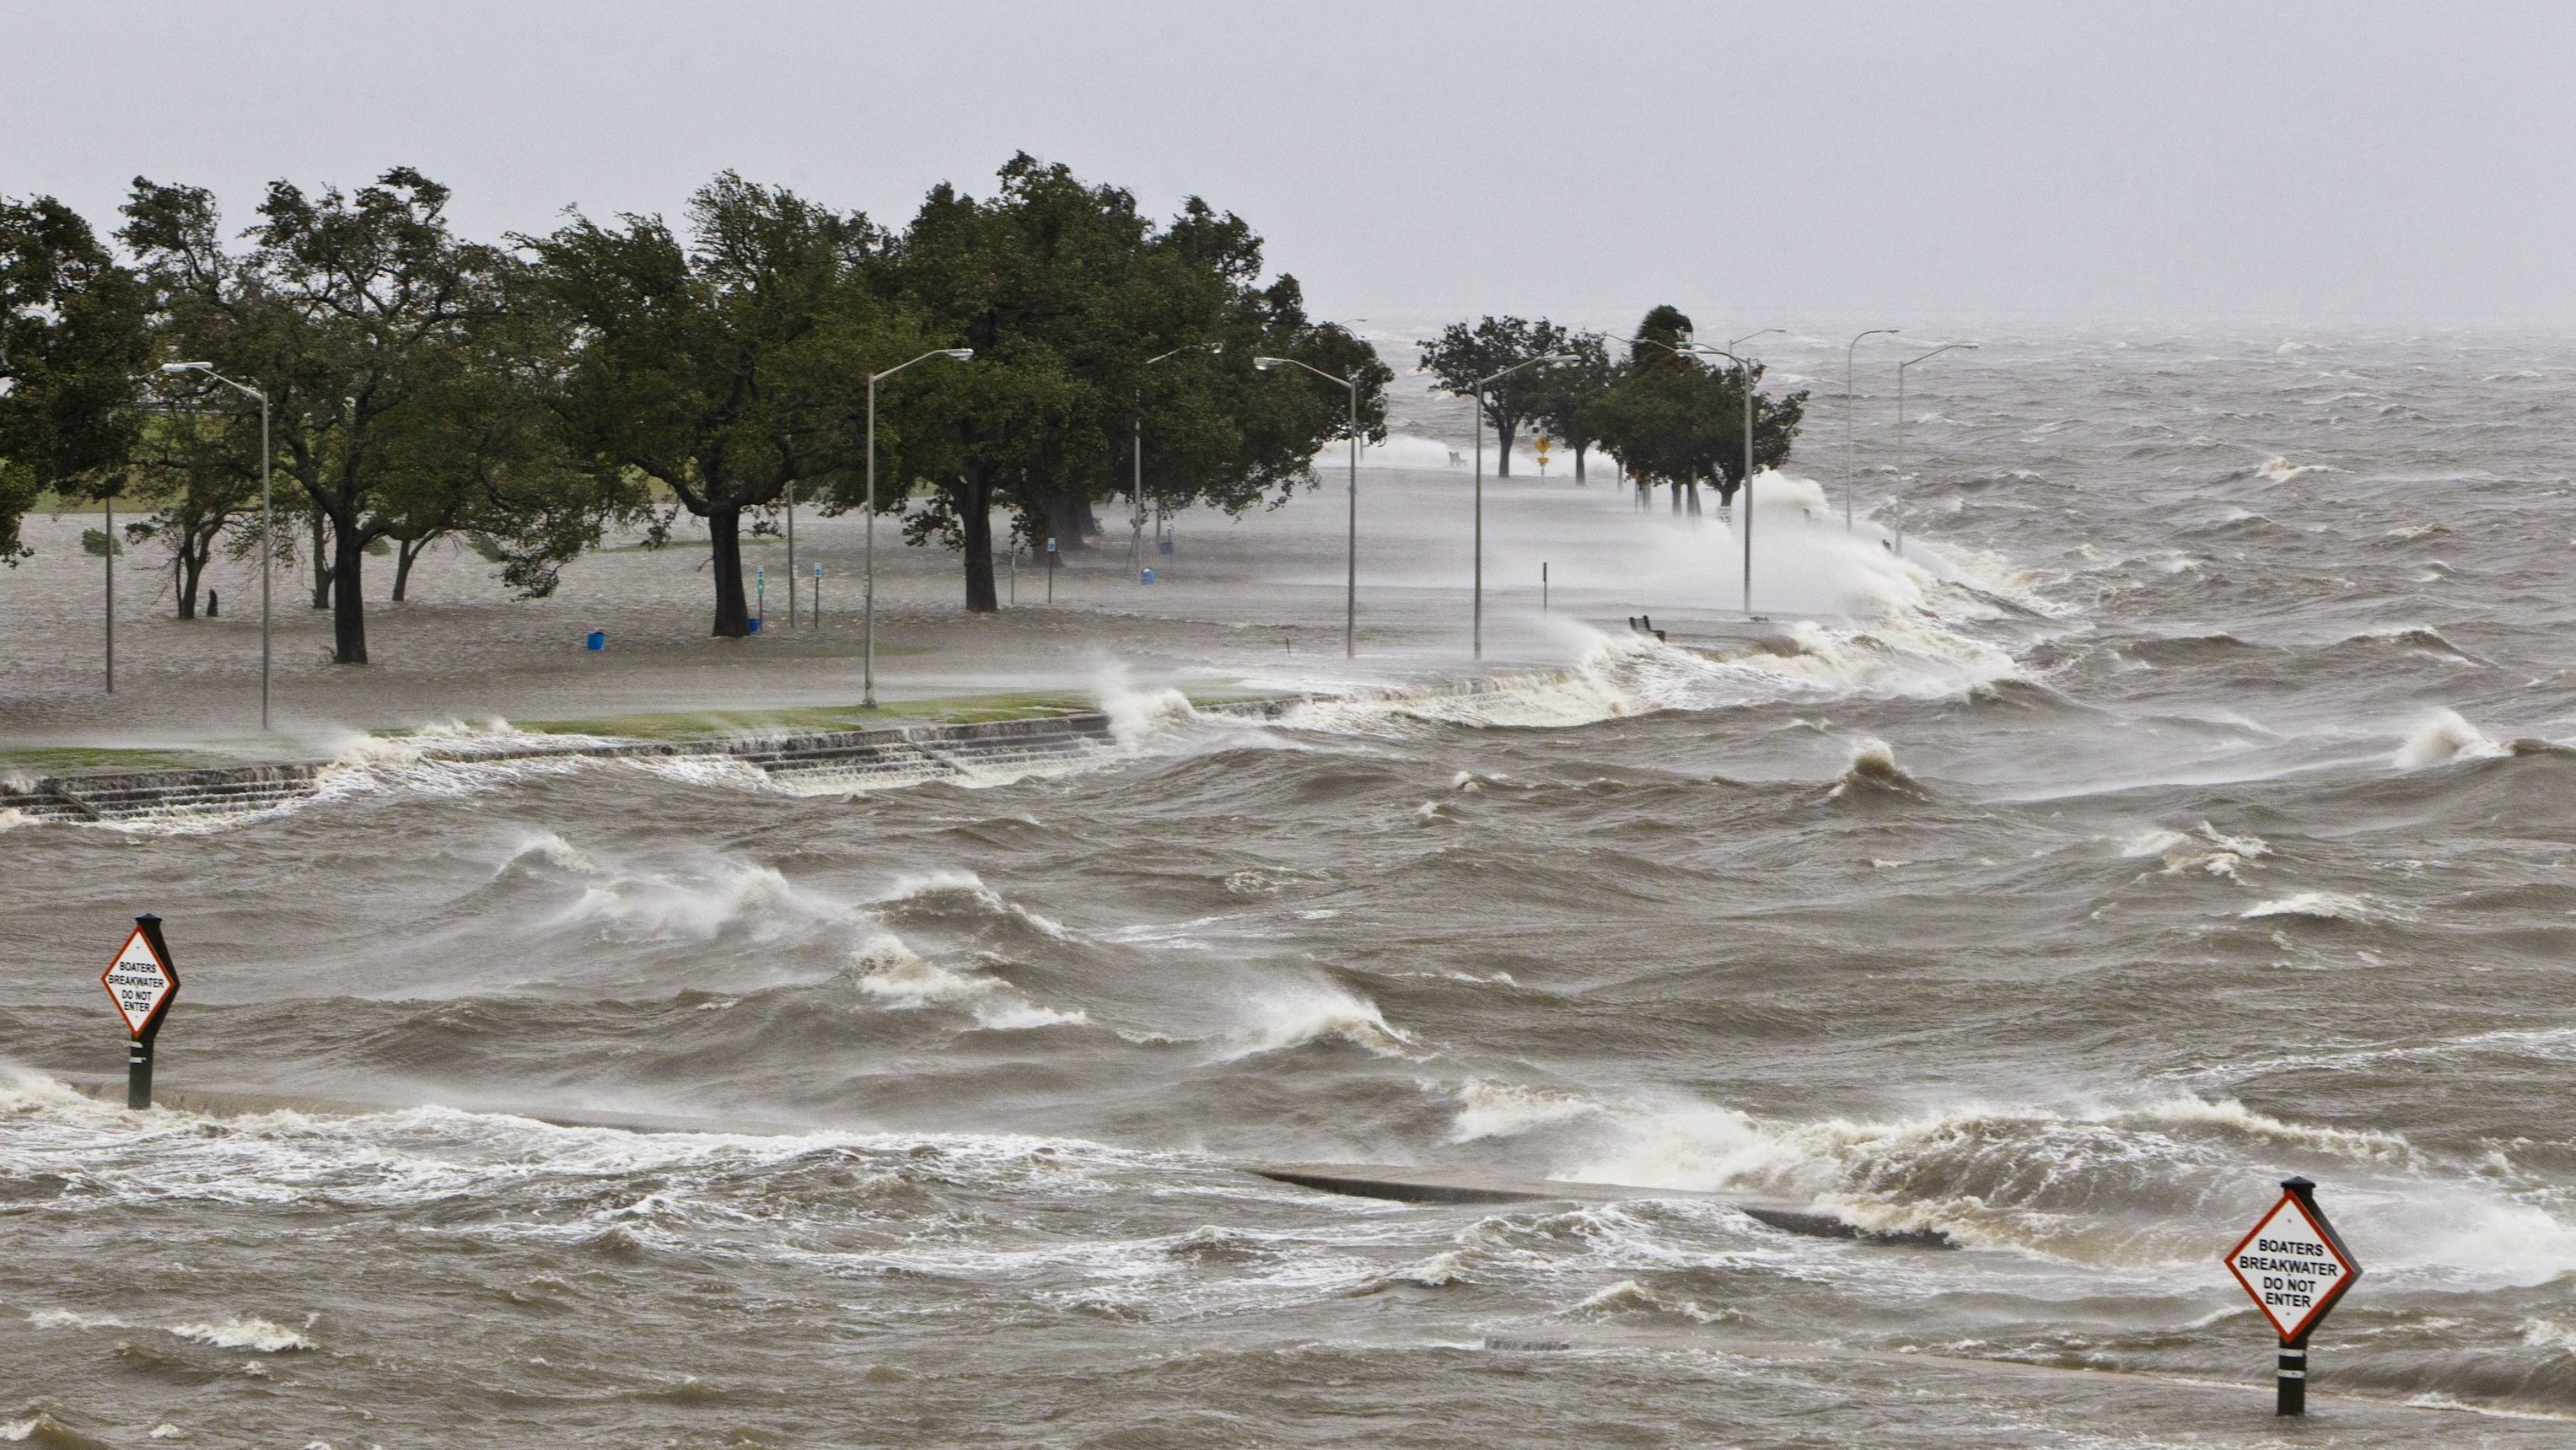
Water is different. It rises inexorably, under doors and through windows. No room is safe. Entire neighborhoods are engulfed at once – there is no accessible safe haven once the water begins to rise. Storm surge water seethes with debris, from toxic waste to power lines to floating vehicles. And unlike the wind, which weakens quickly as a storm departs, storm surge and inland floodwaters can engulf a region for days to weeks. Those who don’t drown during the storm are often trapped without water or food until rescue personnel arrive, and when the impacted area is large and damage is extensive, rescue can be slow coming.
Hurricane Matthew
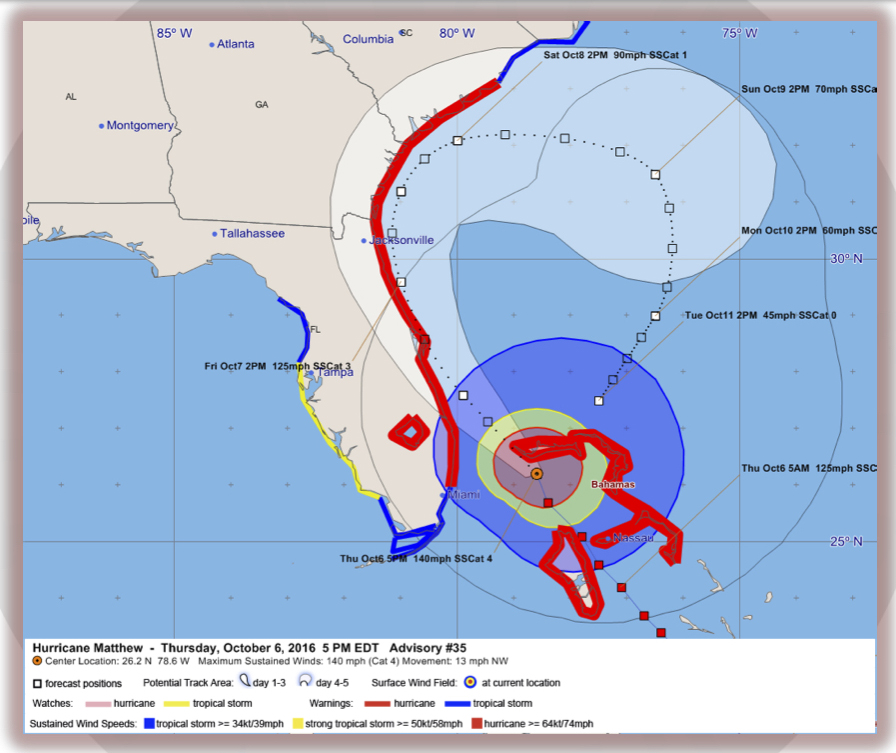
If you were watching news coverage as Hurricane Matthew marched menacingly up the east coast of Florida earlier this month, you probably noticed that meteorologists and local officials were focusing far more on the potential for unprecedented storm surge than on the storm’s maximum winds, despite Matthew being a Category 3 or 4 storm with winds up to 145 mph at times. Major Florida cities along the Atlantic coast and along the St. John’s River (which empties into the Atlantic Ocean just east of Jacksonville, FL) were threatened by a storm surge unseen for at least a century.
Matthew was a major hurricane with destructive winds, but it was the water, not the wind, that led governors, mayors, meteorologists, and emergency managers alike to issue impassioned pleas for those in the path of the storm to evacuate. Like hurricanes Sandy, Ike, and Katrina before it, Matthew testified to the fact wind tells only part of the story of a cyclone’s destructive power.
The rest of that story, and the far deadlier chapters, are told by water.
And starting this year, emergency managers, public officials, and the general public have another tool to evaluate the impact of that water on their communities. Developed by the National Weather Service and made operational for the 2016 hurricane season, Potential Storm Surge Flooding Maps are specific to each tropical cyclone and show a reasonable worst-case scenario for storm surge inundation at the neighborhood level. In other words, it shows the storm surge heights that a person should prepare for before a storm, given the uncertainties in the meteorological forecast.
Potential Storm Surge Flooding Maps
The Potential Storm Surge Flooding Maps are based on the existing National Weather Service (NWS) Sea, Lake, and Overland Surges from Hurricanes (SLOSH) model. (Modeling involves a dizzying and inescapable array of acronyms.) The SLOSH model takes into account forecast uncertainty and, when run as an ensemble, provides an envelope of possible storm surge outcomes based on the current forecast.
Ensemble modeling involves running a model (or group of models) many different times, each time with small differences in the initial conditions or model assumptions. For the SLOSH model, these differences represent plausible futures for the track and intensity of the hurricane given current observations and historical forecast errors. The result is a set of possible storm surge scenarios, with each member of the set representing a slightly different hurricane track and intensity.
Once this set – or “ensemble” – is assembled, it is analyzed statistically to determine a reasonable worst-case storm surge scenario at each location, and the depth of that storm surge is displayed on the Potential Storm Surge Flooding Maps. In this instance, “reasonable worst-case” is defined as that storm surge depth which has a 1-in-10 chance of being exceeded at each location. (In other words, at any given location, there is a 90% chance that the actual storm surge will be less than or equal to what is displayed on the map, given the current forecast.)
Utility and Limitations
The Potential Storm Surge Flooding Maps are a valuable visual tool to assess storm surge risk as a tropical cyclone approaches land. The SLOSH model that forms the basis of the maps takes into account the factors most critical in determining storm surge:
- The hurricane’s forward speed, angle of approach to the coast, and landfall location
- Forecast uncertainty in the hurricane’s track, intensity, and wind field
- Astronomical tides
- The specific topography of the coast
- Artificial features like roads and levees
However, the potential storm surge flooding map does not take into account a number of factors that do not impact storm surge directly but that nonetheless greatly impact overall flooding and water damage. The maps do not account for:
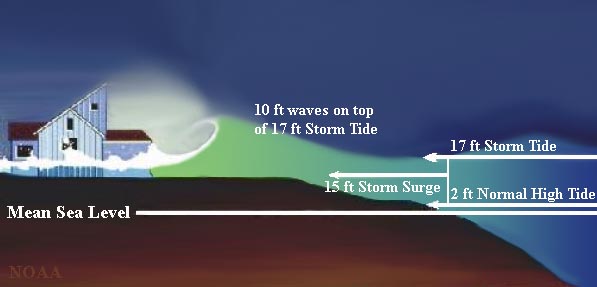
- Wave action (i.e. waves that occur on top of the storm surge)
- Freshwater flooding from rainfall
- Riverine discharge (i.e. river flooding)
- Flooding resulting from levee failures
- For mapped leveed areas – flooding inside levees, overtopping of levees
Wave action
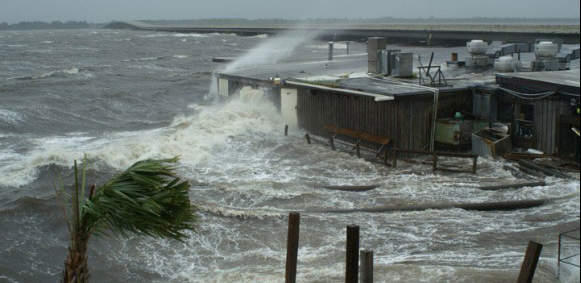
Wave action can significantly increase the impact of storm surge along the immediate coast, overtopping seawalls and sandbags where the storm surge alone would not. The potential storm surge flooding maps show only the potential storm surge – they do not provide any information about expected wave height. In many cases, the height of waves riding atop the storm surge can exceed the height of the storm surge itself.
Information about expected wave height and wave action impacts can be found in hurricane-related text products from the National Weather Service, including the local area forecast discussions and hazards and impacts statements. Interests along the coast and in areas protected by levees should pay particular attention to the impacts of wave action and weigh those impacts in addition to the direct impacts of the storm surge when making hurricane preparations.
Freshwater and Inland Flooding
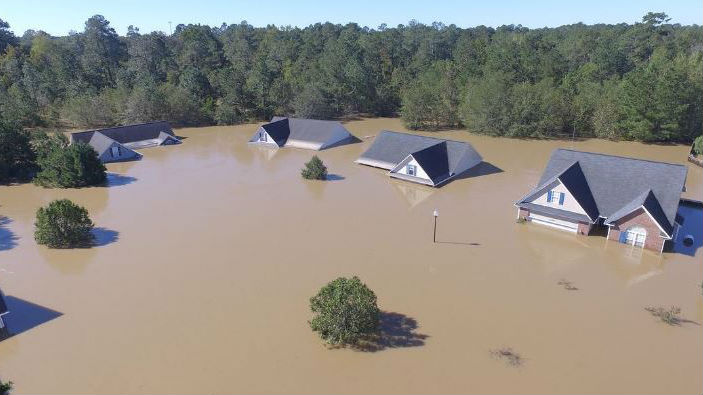
Flash flooding, areal flooding, and river flooding due to excessive rainfall are responsible for over one quarter of all tropical cyclone-related deaths and can impact areas far inland and outside of the storm surge risk area. Hurricanes and tropical storms can dump tremendous amounts of rain in a short period of time. Even weak tropical systems can produce devastating amounts of rain. For example, the remnants of Tropical Storm Amelia in 1978 flooded central Texas with four feet of rain. Interests in low-lying areas prone to flooding and along creeks and rivers expected to be impacted by a tropical system should pay careful attention to rainfall forecasts and expected impacts.
Levees
Forecasting the protection offered by levees during a tropical cyclone is complex and difficult, as Hurricane Katrina tragically demonstrated in 2005. Wave action, the depth and speed of the storm surge, and the strength and construction of the levees all influence the amount of protection they provide. Interests living in leveed areas need to remain especially vigilant as a tropical cyclone approaches, and consider all relevant risks, not just those posed by the storm surge.
Application during Hurricane Matthew
The potential storm surge flooding maps issued during Hurricane Matthew’s approach of Florida’s east coast offered a clear and dire assessment of the risk for unprecedentedly severe storm surge inundation.
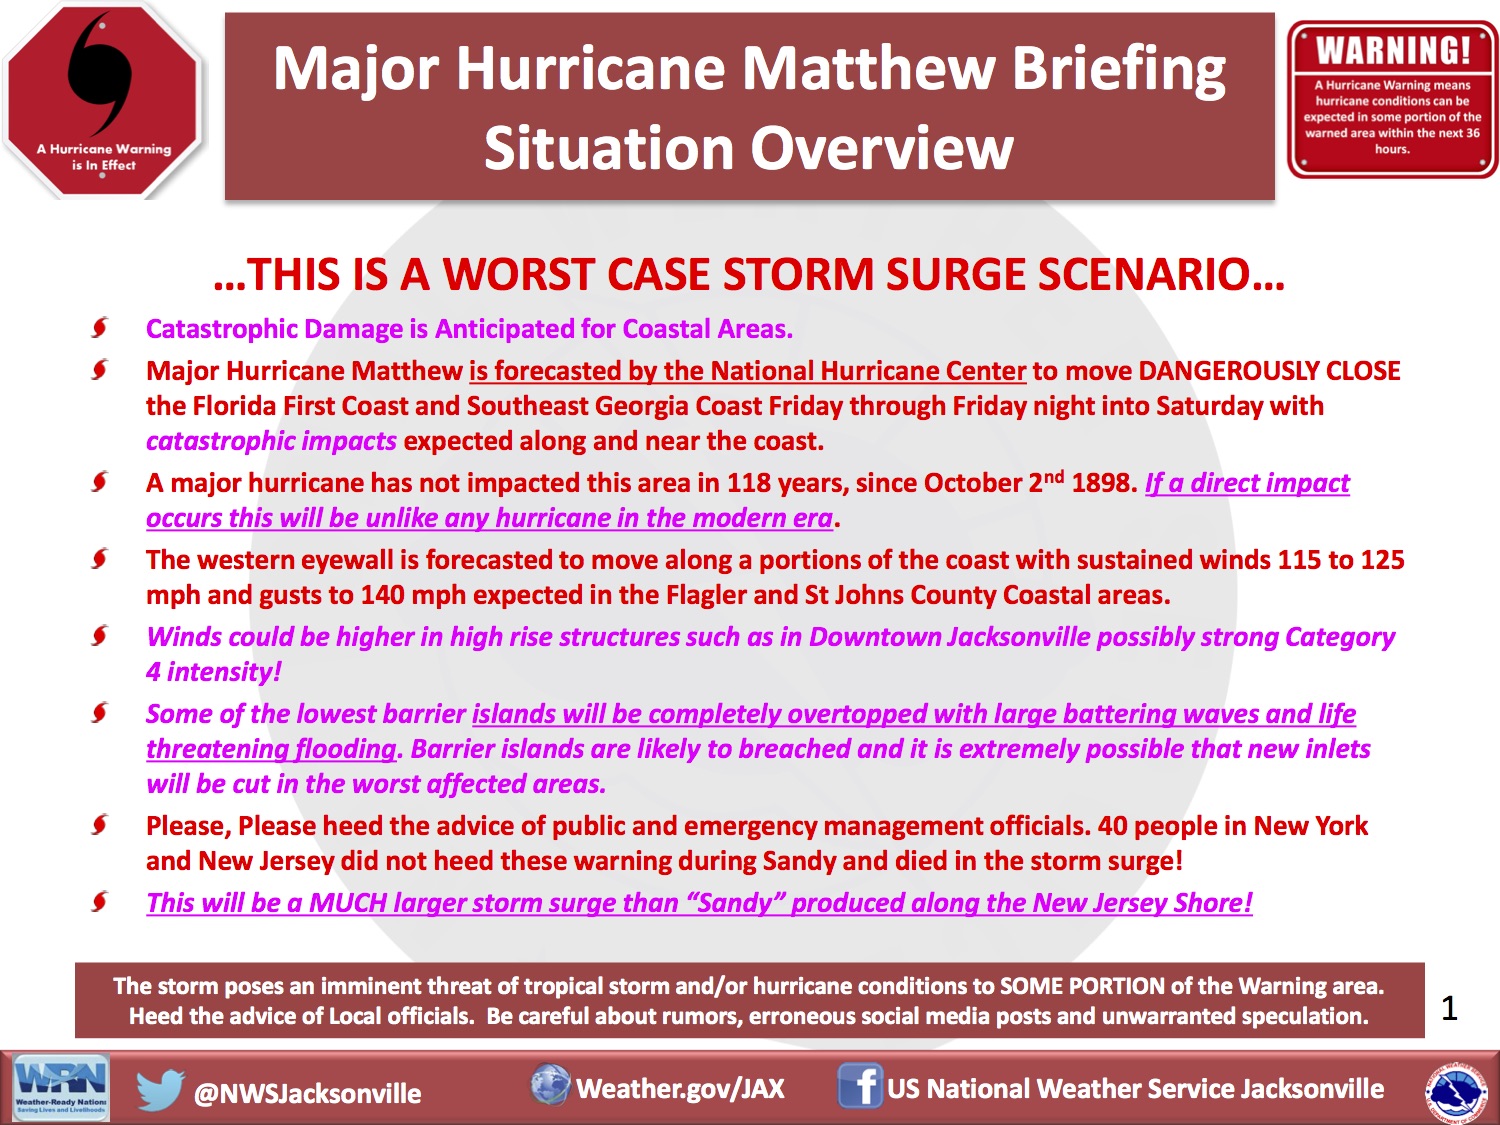
The maps for Hurricane Matthew were so dire because the worst-case scenario was squarely within the cone of uncertainty. It wasn’t just possible. It was likely that locations along the east coast and the St. John’s River would be under several feet or more of water if the hurricane continued to hug the coast or made landfall in northeast Florida or southeast Georgia.
More than just the beaches were under threat. The potential storm surge flooding maps showed areas along the St. Johns River — inland regions that don’t typically think of themselves as vulnerable to storm surge –- under up to 6 feet of water as Matthew pushed a wall of water at the coast and up the mouth of the St. Johns. Although the worst-case scenario fortunately did not materialize, reports were still received of the St. Johns River flowing backwards on the morning of Saturday, October 8th, as storm surge and hurricane-force onshore winds pushed the sea inland.
“Fortunately” is the correct word in this situation, because it was nothing more or less than luck that prevented a truly worst-case scenario from actualizing. Had Matthew drifted 20 miles farther the west, the Atlantic coast of Florida, and inland river cities like Jacksonville and Palatka would have experienced truly devastating flooding.
The Bottom Line
The National Weather Service’s new potential storm surge flooding maps provide a graphical, easy-to-understand, quantitative assessment of storm surge risk along the U.S. Gulf and Atlantic coasts. By displaying a reasonable worst-case scenario at each location, they show both local officials and the general public the storm surge depth for which they should prepare themselves, enabling well-informed preparation and evacuation decisions.
However, these maps are not intended to offer a complete picture of water-related risks associated with tropical cyclones. They do not take into account wave action (i.e. waves riding atop the storm surge), rainfall-induced flooding, or potential levee failures. These impacts must be considered separately when assessing the impact of a hurricane or tropical storm in a given area.
And, as always, the output of any model is only as good as its input.
Ultimately, the accuracy of the potential storm surge flooding maps depends on the accuracy of the hurricane track and intensity forecast. Those forecasts – and the storm surge inundation maps derived from them – are continually refined as new data from in-situ and remote sensing platforms (like hurricane hunter aircraft measurements and satellite imagery, respectively) as well as new model guidance become available.