Population Bias in NOAA Storm Reports: Implications for Risk and Impacts Assessment in Rural Areas
The National Oceanic and Atmospheric Administration (NOAA) Storm Events Database (SED) serves as an official record of severe and significant weather impacts in the United States. These data provide the foundation for our understanding of both the impact of individual storm events as well as the climatology of severe weather hazards across the country, and they are regularly relied upon by professionals across diverse disciplines, including meteorologists, insurers and reinsurers, engineers, planners, emergency managers, and the legal system in their quests to understand risks and impacts.
At Blue Skies, we use NOAA SED data on a daily basis. And anecdotally over the course of 13 years, we’ve noticed that when a severe thunderstorm impacts a rural area, there tend to be fewer storm reports. Intuitively, this makes sense: NOAA storm reports are initiated when an observer reports a severe or significant weather-related impact to the National Weather Service (NWS). If there are fewer observers around, it’s less likely that someone will see and report the weather impact.
This is why we say “absence of evidence is not necessarily evidence of absence”. Just because a storm-related impact wasn’t reported doesn’t mean it didn’t happen. It may just mean that no one was around to see it. The tree blown down by a storm in the empty forest still makes a sound, even if it doesn’t make a NOAA SED storm report.
To test whether these anecdotal observations reflect a systemic population bias in the Storm Events Database, Blue Skies’ founder and principal atmospheric scientist, Megan D. Walker, CCM, examined reports of severe wind and hail from the past 70 years across five metropolitan areas in the central United States that experience a relatively high frequency of both hazards. These metropolitan areas were chosen because each consists of a densely populated urban core surrounded by suburban areas of moderate population density and outlying rural areas, across which the severe weather climatology can be considered constant. In other words, across these metro areas, the population density varies while the frequency of severe wind and severe hail remains the same.
By comparing the spatial density of severe wind and hail reports to the population density across these five metropolitan areas, this research found a clear population bias in NOAA Storm Events Database records across these regions: counties with higher population densities tend to also have higher densities of severe wind and severe hail reports. In fact, urban counties had on average 4 times more reports of severe wind and hail per square mile than adjacent rural counties. This population bias was found to scale linearly with population density, and the relationship was consistent between wind reports and hail reports.
This finding has important implication for our interpretation of the NOAA Storm Events Database. Specifically, it indicates that we may be underestimating the occurrence of severe wind and hail in rural areas, thereby underestimating storm-related risks. The accuracy of severe weather risk and impacts assessments in rural areas would therefore likely be improved by incorporating additional indicators of storm-related impacts that are less dependent on population density (e.g. NWS warnings and radar data).
Ms. Walker presented the findings of her research at the 106th Annual Meeting of the American Meteorological Society in Houston, TX, in January 2026. For those who would like more information about this research, please check out the extended abstract, and feel free to reach out with any questions.
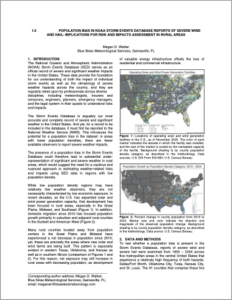
The study area consists of five metropolitan areas comprised of 91 counties. Counties are shaded by the log10 of the county population density in 2020. Data source: U.S. Census Bureau.
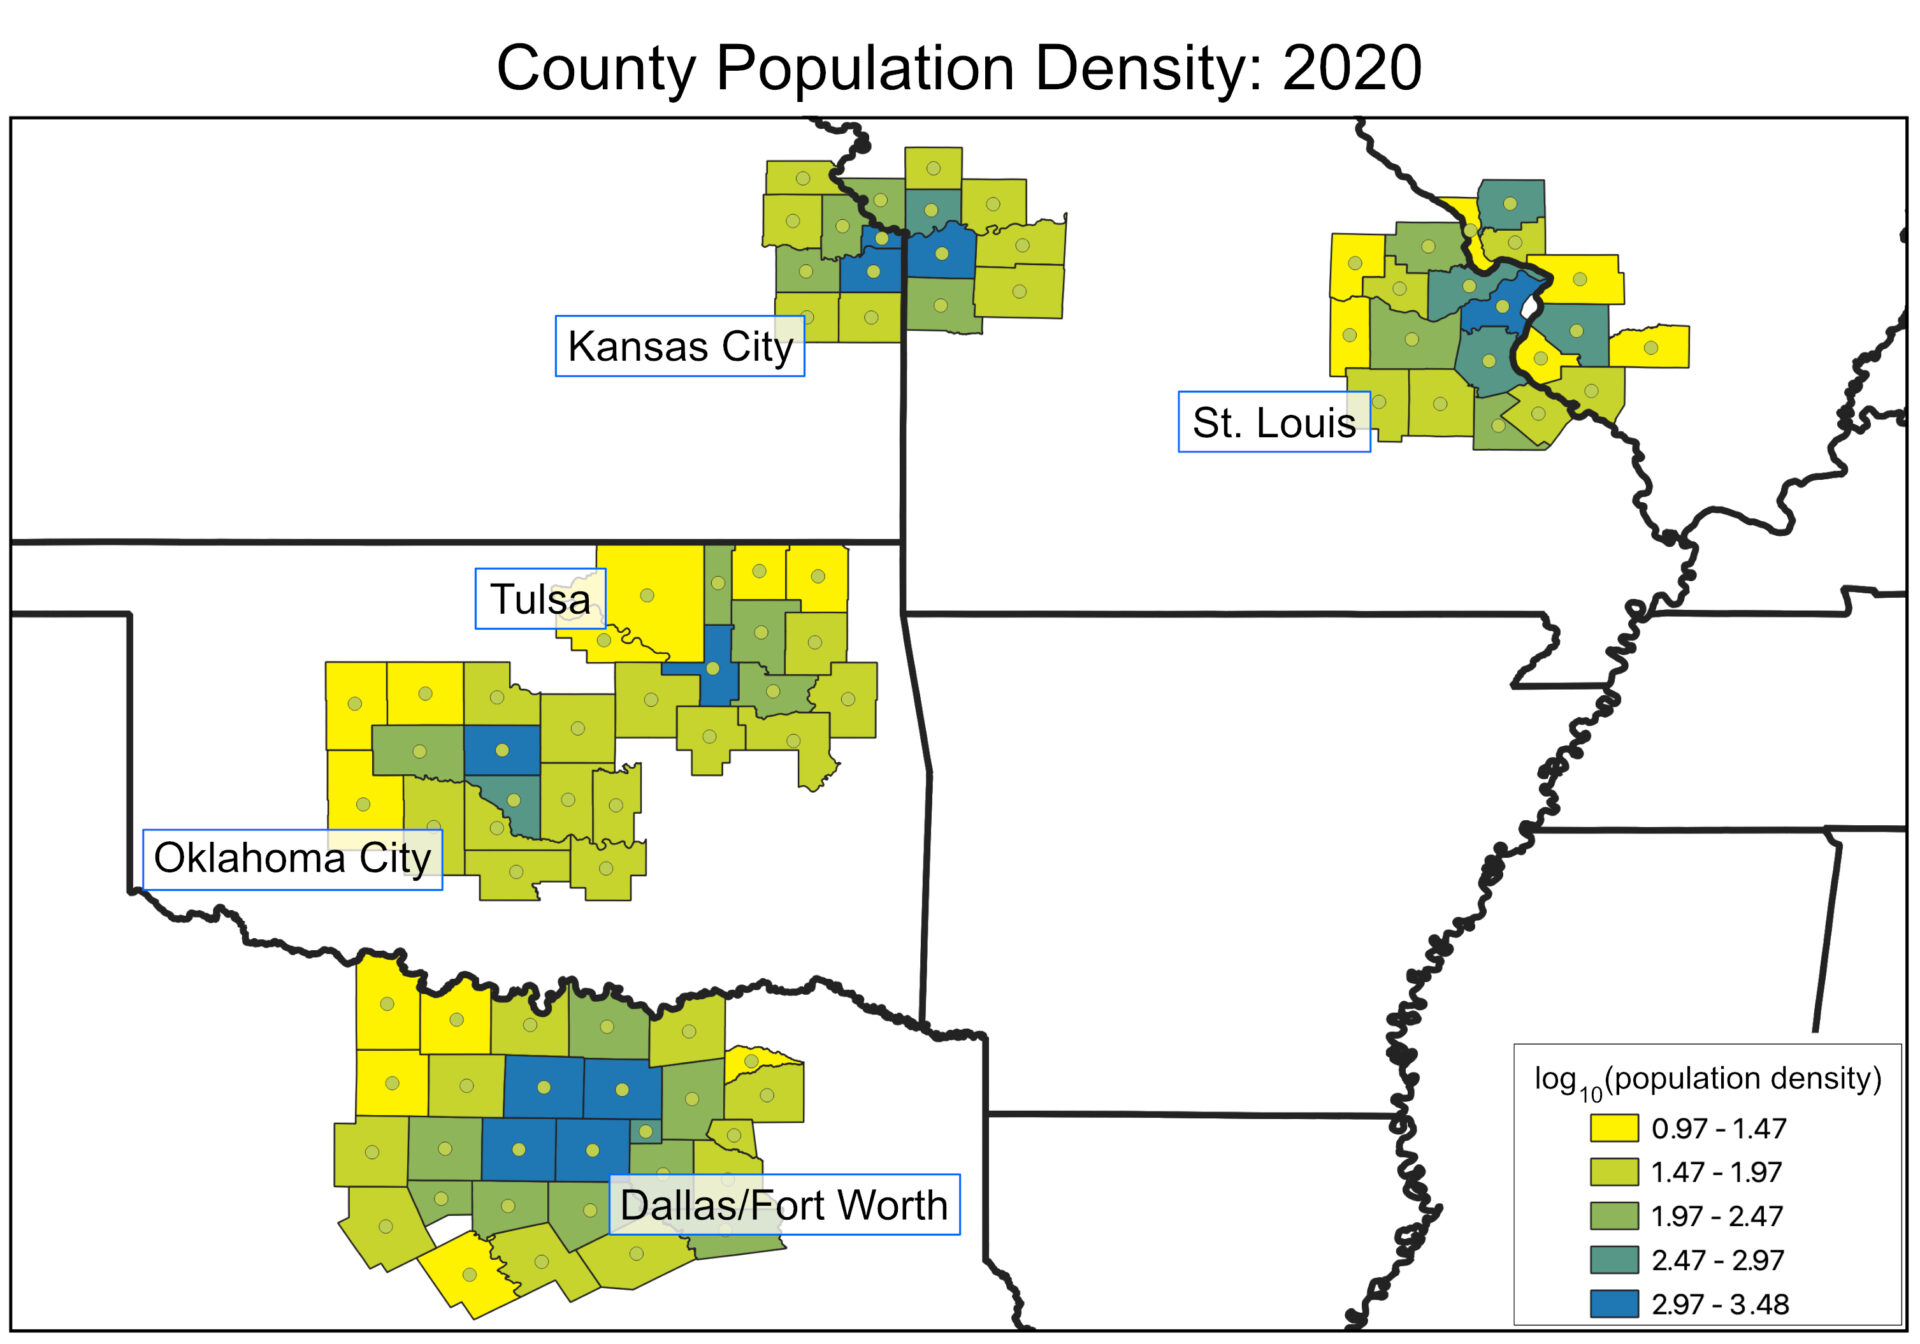
Spatial density of severe hail reports by county, 1955 – 2024. Data source: NOAA Storm Events Database.
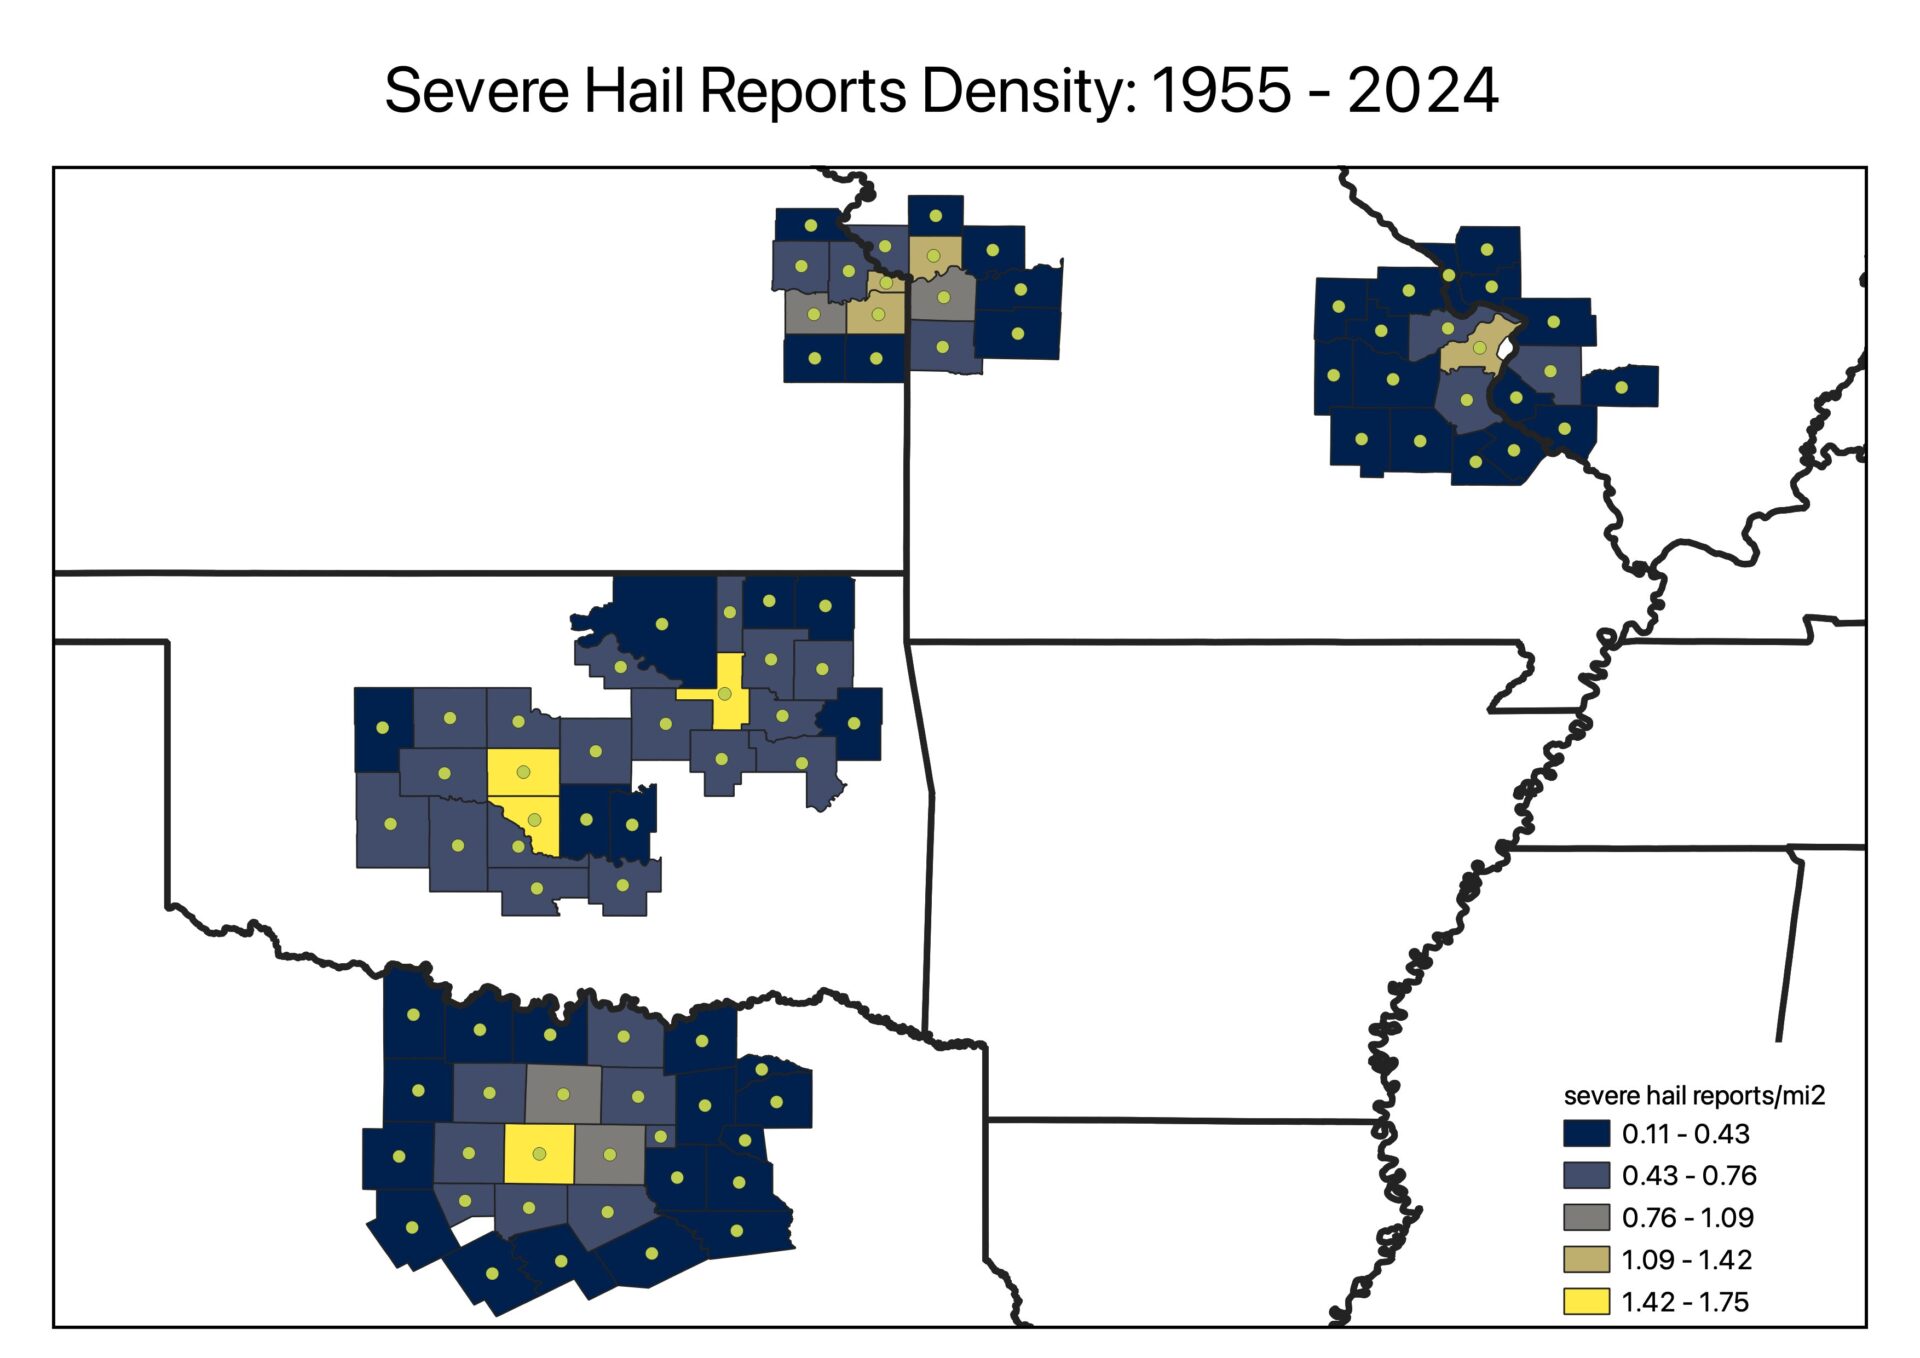
Spatial density of severe wind reports by county, 1955 – 2024. Data source: NOAA Storm Events Database.
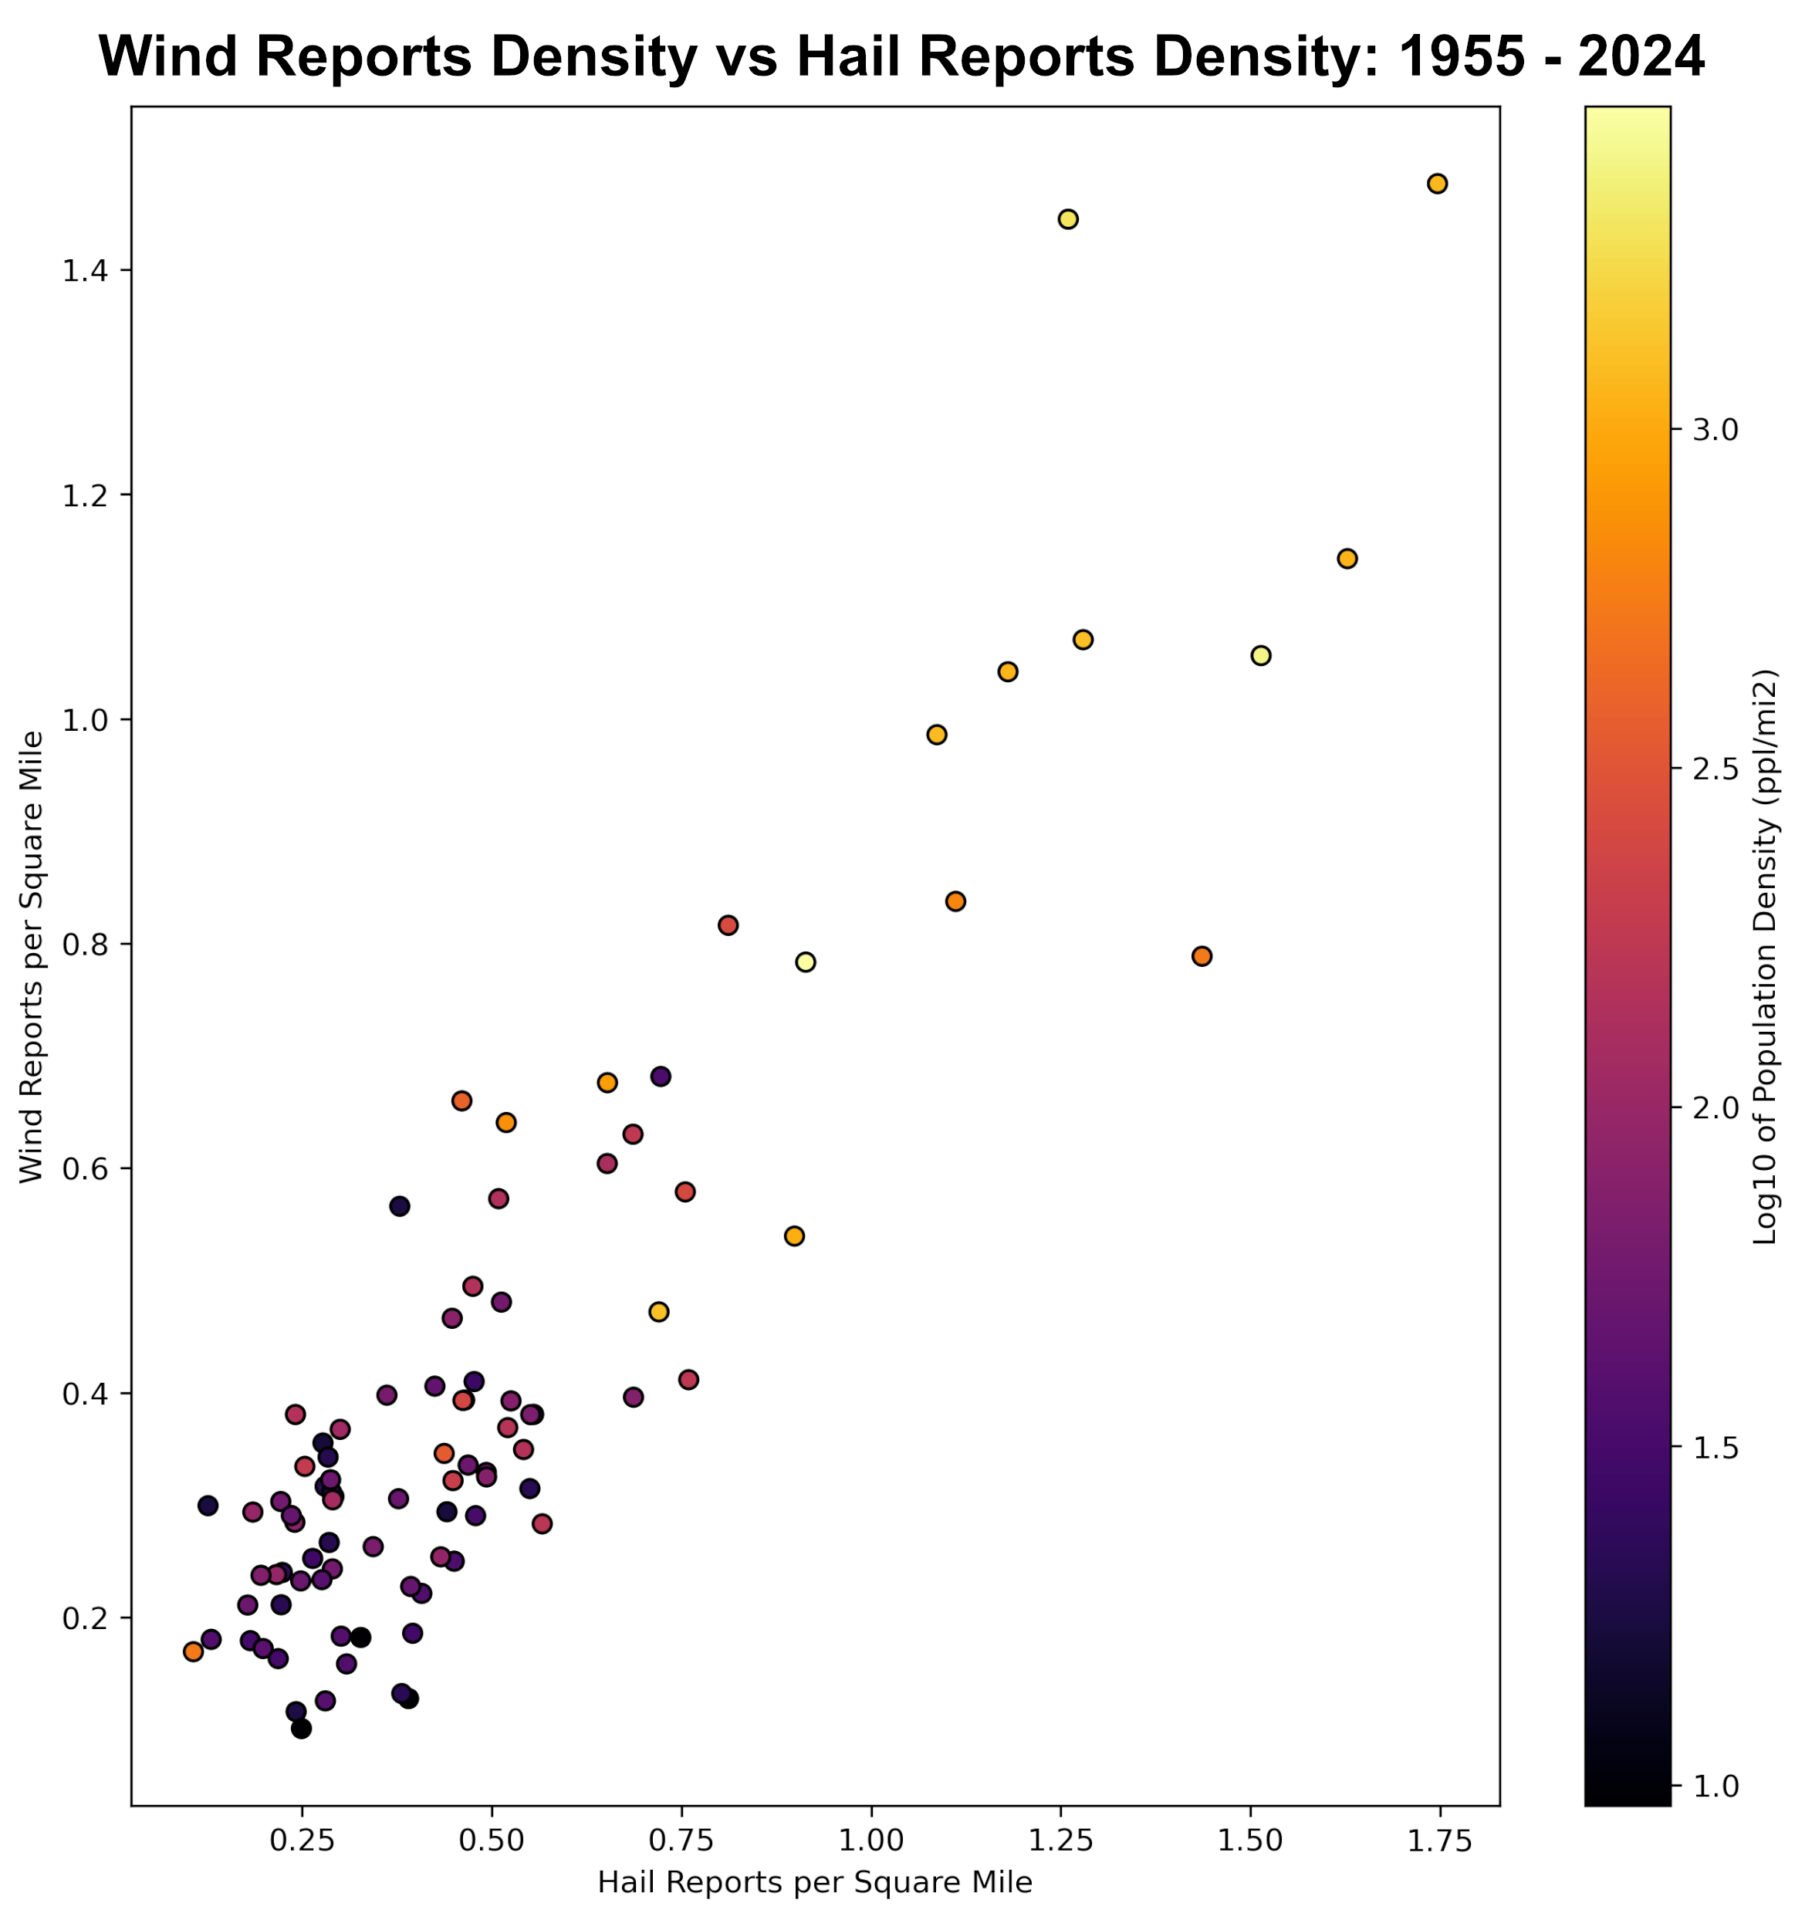
Spatial density of wind reports vs spatial density of hail reports for all 91 counties in the study area. The population density of each county is indicated by the color of the marker. Data sources: NOAA SED; U.S. Census Bureau.